
This post is translated from Chinese to English using ChatGPT 3.0 as an experiment without my editing. Does it pass the Turing Test?
1.0 One Paragraph Thesis:
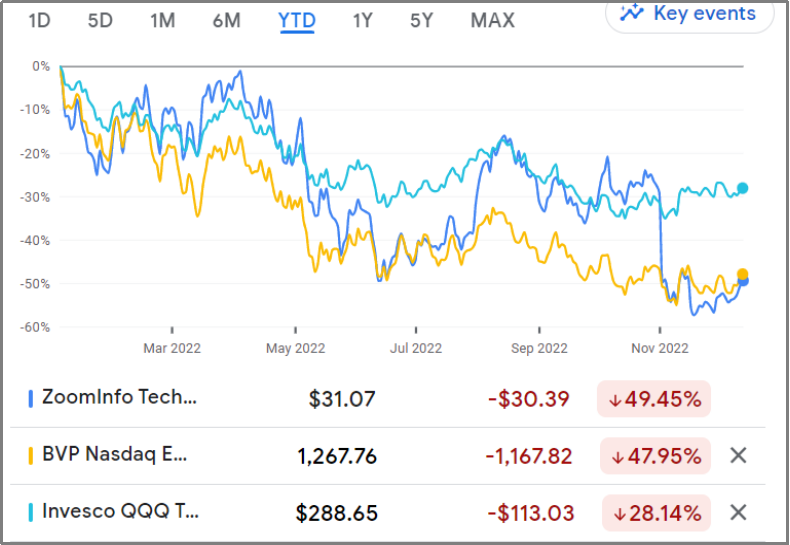
A data SaaS company with a long growth runway, high revenue growth, high gross margin, high profitability, and cash flow production capability. The more data assets accumulate, the more valuable they are, with short sales and delivery cycles, perceived quick-time-to-money, high user stickiness, and operating leverage. The company has further established data-driven marketing tools through R&D and acquisitions to increase the value and usage habits of terminal users. The market mistakenly categorizes ZI with other high-growth but unprofitable SaaS companies and YTD stock price has fallen with the Federal Reserve’s interest rate hikes and the SaaS sector. As macro pressures ease, the company’s large concentration in software client vertical, longer sales cycles, and insufficient sales team bandwidth may improve. In the medium to long term, operating margins and ROIC will continue to improve as revenue scale and growth reach a steady state. Annual returns of over 20% are expected.
2.0 Company Background:
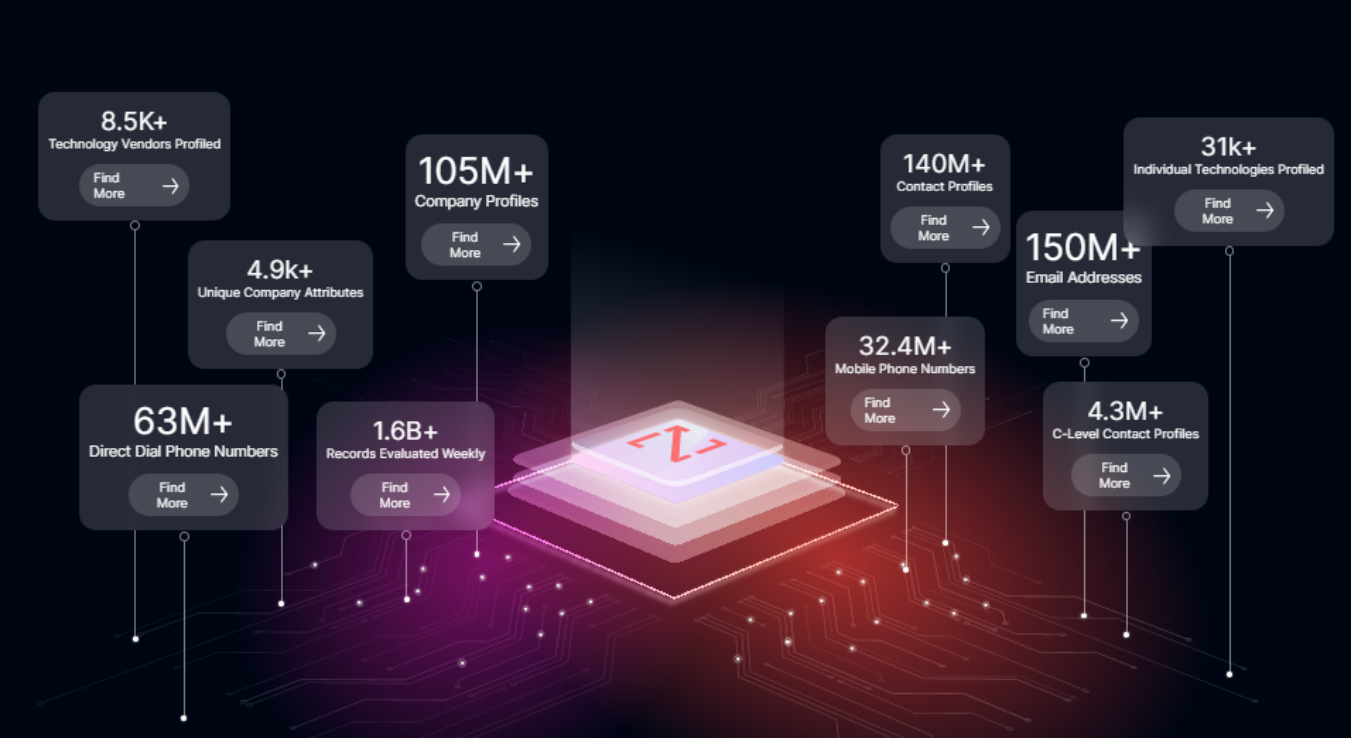
ZoomInfo (code: ZI.O) is a US B2B enterprise database and operations software provider that serves Go-To-Market teams of other B2B companies. It provides data and software tools for lead acquisition, prospecting, process management, customer outreach, and internal team collaboration in the sales process. Its core database covers enterprise data, personnel data, and buyer intent data (105 million companies, 300 filtering g features, 140 million personnel information, 50 million mobile phone numbers, 150 million emails, etc.). ZI originated from a database but, through R&D and acquisition (mostly driven by acquisitions), has built a tool matrix on top of its data assets. Its target audience is front-line employees and managers in sales, sales operations, marketing, and HR recruitment departments. In short, ZI is similar to Bloomberg Terminal or Capital IQ for B2B sales and operations personnel and is an important tool for increasing sales and efficiency. With data-driven tools, a new salesperson does not need to start from scratch, they can simply open the app or webpage and start searching to fill their customer pipeline or do data enrichment for an existing customer directory.
The company’s predecessor was the enterprise data company DiscoverOrg, founded by current CEO Henry Schuck in 2007. In the first half of its development, it was mainly bootstrapped, and after introducing PE capital TA Associates and Carlyle in 2014, it began its acquisition journey, completing 14 public transactions since 2015. The targets were mainly other B2B data companies, gradually expanding to marketing automation, AI data processing, team collaboration, customer interactions, and recruiting tools using these data. In February 2019, DiscoverOrg acquired rival Zoom Information and changed its name to ZoomInfo. Later, on June 4, 2019, it IPO’d on the Nasdaq, with a per-share price of $21, raising $900 million. The stock price rose 90% on the first day of listing, with a market value of $8.2 billion. The company currently has approximately 3,600 employees.
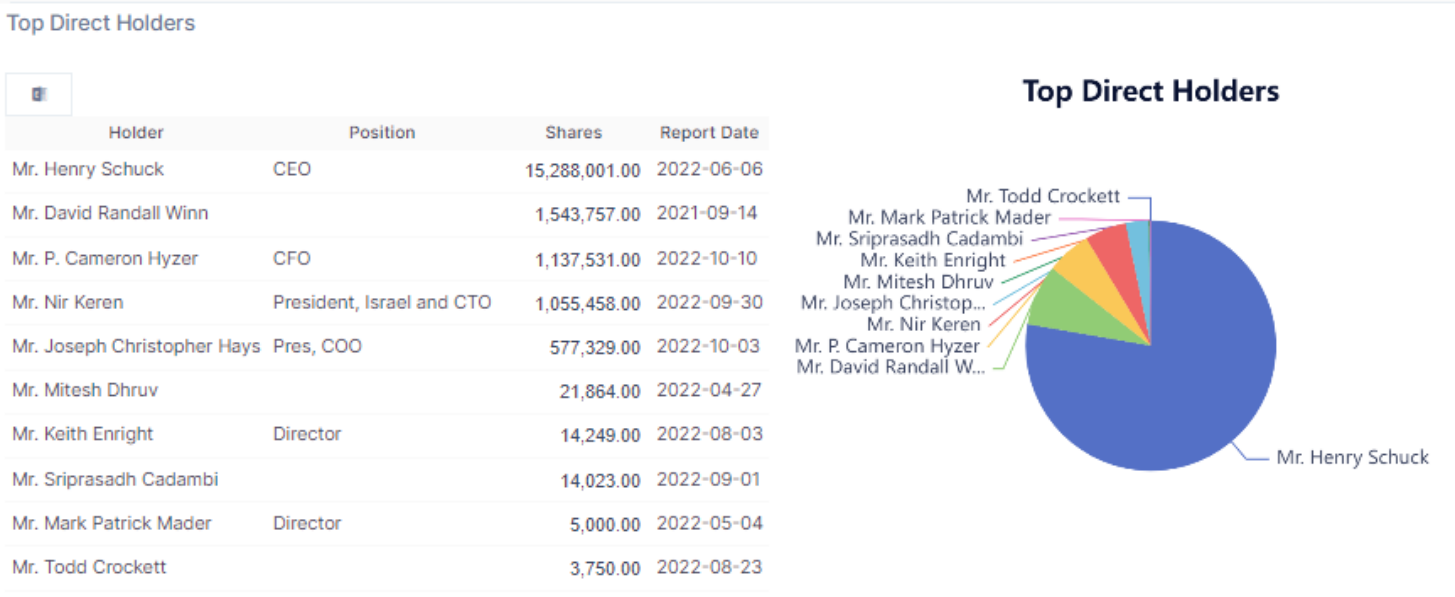
Management holdings: The founder and management hold a 4.5% stake, with no A/B stock structure. Institutions hold 70%, with Carlyle, Vanguard, Morgan Stanley, TA Associates, and Capital Woods holding 9.4%, 7%, 6%, 5.8%, and 5.6%, respectively.
3.0 Business Model and How They Make Money:
3.1 Sources of Revenue: 99% of revenue comes from data and SAAS product subscriptions with contract terms ranging from 1-3 years (non-cancellable). Customers pay subscription fees annually or quarterly (slightly less than 50% of customers choose annual payments), and ZI recognizes revenue on a pro-rata basis (monthly or quarterly), resulting in a significant amount of deferred revenue on the books but good cash flow. The sales model is primarily direct inside sales, with relatively simple delivery and no complex channel partner ecosystem. ZI’s data and tools are also integrated with other third-party service providers such as Salesforce, Microsoft Dynamics, Hubspot, Snowflake, Amazon Redshift, Google BigQuery, etc., who are loose channel partners of its products. Data products lead the way, and SaaS products are bundled and sold together, providing opportunities for single-department and cross-department up-sell and cross-sell. ZI’s revenue is mainly divided into two categories:
- Data product (~85% revenue): New customers usually come to get company/person profiles and contact information, and contract pricing is divided into platform fees and seat & data fees. The platform fee is a fixed fee for opening an account, and the seat & data fee increases with the number of users and data package subscriptions. Currently, the platform fee usually accounts for less than 50% of the annual contract value (ACV), and the seat and data fees account for the remaining part.
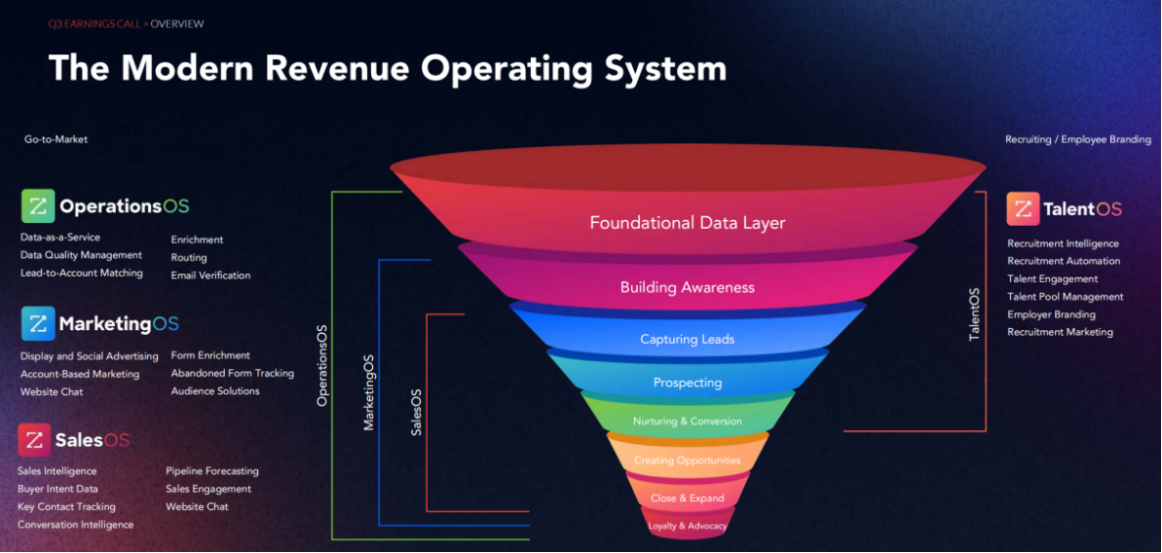
- Workflow Tools (~15% revenue): ZI has created four SaaS modules (company refers to these as advanced functionalities) around its core database for different use cases, which require additional subscriptions and are charged by seats and functionality modules. Successful bundled sales further increase ACV:
- SalesOS: Provides lead digging, customer relationship management, and sales process optimization for sales scenarios.
- MarketingOS: Provides lead generation, lead nurturing, and campaign management for marketing scenarios.
- ServiceOS: Provides customer service management and customer service process optimization for customer service scenarios.
- AdTechOS: Provides cross-channel advertising optimization and ad performance analysis for advertising scenarios.
3.2 Pricing example:
- RevOS: An enterprise customer with 25-50 Advanced version seats has an ACV of approximately $50K, of which $25K is the platform fee (as shown below), and the remaining $25K is the seat & data fee. The list price for each seat in the Advanced version is $2500, but there is actual bulk pricing in the signed contract, with actual prices ranging from $500 to $1000. Upgrading to the Elite version will add the purchase intention data and other workflow functions, and the ACV will increase by 30-50%.
- OpOS: Adds operation collaboration, external system integration, and data enrichment functions (such as Salesforce, Snowflake, Hubspot, etc.). OpOS ACV may be greater than RevOS, bringing an additional $100K ACV uplift.
- MarketingOS and TalentOS are new products, and specific commercialization information is currently missing. Comparably was acquired with an ARR of about $150 million, and the volume is not large.
- Looking at the product development roadmap and bundling sales potential, an $50K ACV customer can be converted into a six-figure ACV customer by up-selling to other functions from RevOS. In Q4 2022, ZI signed its largest ACV customer in history, with a contract value of over a million dollars. Google, Adobe, Fedex, and other top companies are all ZI customers.

3.3 ZI data sources: 1) ZI provides a free Community Edition, and community members who join must contribute their own collected business card information in exchange for free use of the edition; 2) independent full-network collection. ZI uses data crawlers to monitor 35 million public websites daily, including SEC, corporate websites, etc.; 3) purchase from third-party vendors; 4) data exchange with ecological partners or customers. Some of the company and personnel data can be obtained from public websites such as LinkedIn and some non-public channels, while the main proprietary data is the purchase intention data – buyer intent data – which is measured through data such as keyword searches and website browsing records to measure potential customers’ purchasing intentions. Although a lot of the data comes from publicly available information, the value of ZI’s products comes from the aggregation, cleaning, and organization of data from dispersed sources, combined with some proprietary data packaged together as a standard SaaS product delivery. Although there is some inaccuracy in the contact information of private enterprises and individuals, this general problem in the industry does not affect the overall value of the product. Customer interviews have shown that ZI’s data depth and accuracy in North America is industry-leading, but there is still a lot of room for improvement in international data coverage.
3.4 Customer distribution and retention: ZI is a heavy user and beta tester of its own products.
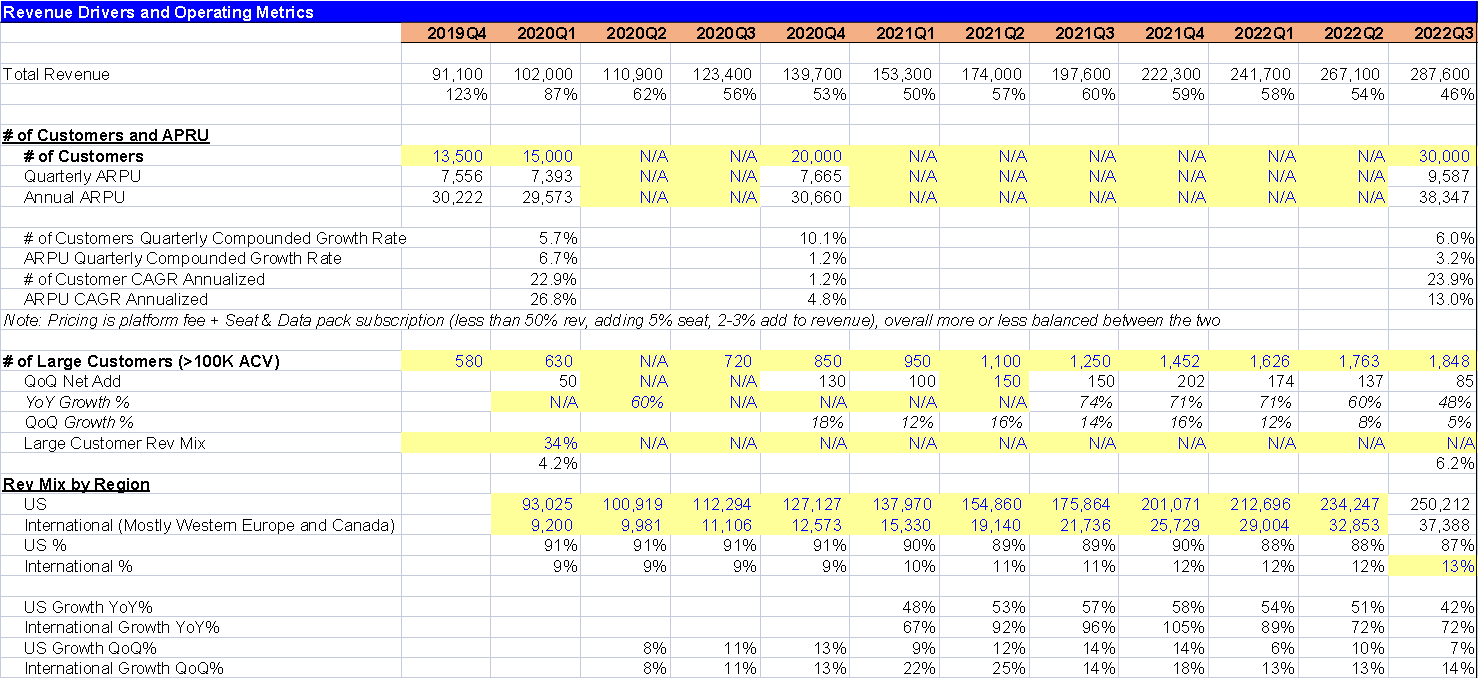
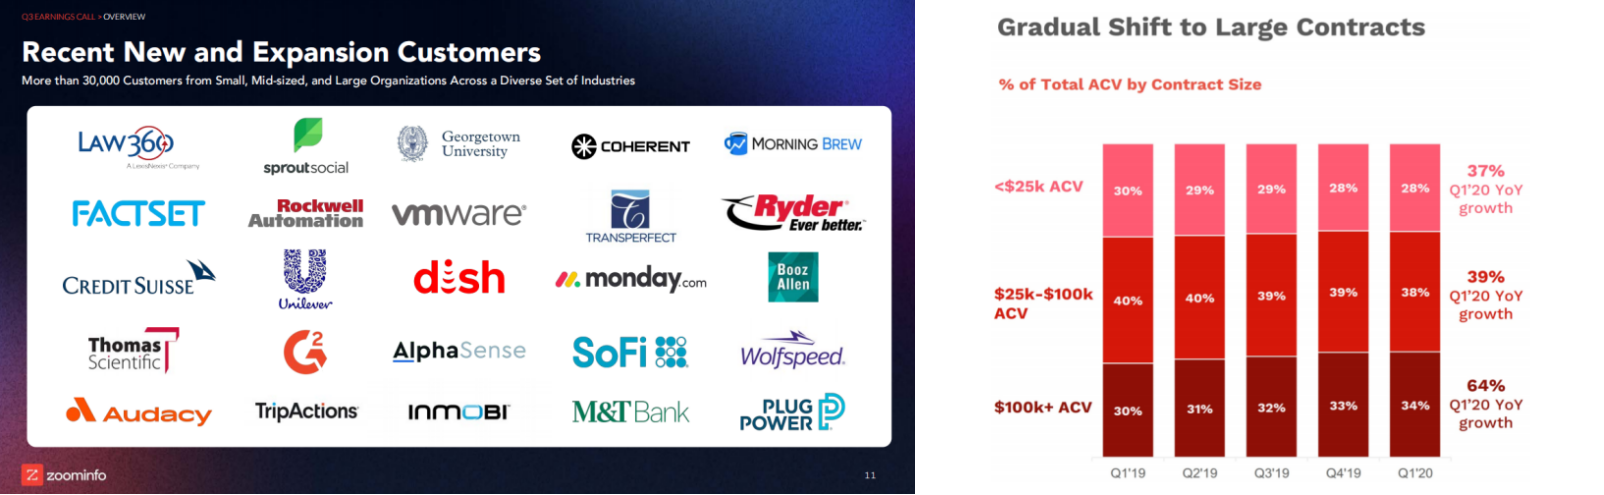
- In Q1 2019, the company had over 12,000 enterprise customers, 1.2 million first-line terminal users, APRU of $2.3 million, and ACV of $10 million or more with 630 large customers, representing 4.2% of the customer base and 34% of ACV.
- As of Q3 2022, the number of customers exceeded 30,000, APRU increased to $3.8 million, and the number of large customers increased to 1,848, representing 6.2% of the customer base. From Q1 2019 to Q3 2022, customer compound quarterly growth was 6.8%, APRU compound growth was 3.8%, and revenue growth was 12%.
- Small, medium, and large enterprises each accounted for about 1/3 of ACV, and customer types covered various vertical industries (SMB 0-99 people, Mid-Market companies 100-999 people, Enterprise large customers 1000+ people). In 2019, 39% and 29% of ACV came from the software and business services industries, as software companies place more emphasis on digitization than traditional industries. Retail, restaurants, hotels, discretionary consumption, aviation, and other industries each accounted for less than 4%. As of Q3 2022, software accounted for less than 40%, business services accounted for slightly more than 20%, and finance, logistics, health, and retail each accounted for low to mid-single digits, with no single customer accounting for more than 1% of revenue.
- Customer use case: TentCraft is a 10-person custom tent company that primarily serves outdoor sports and music events. After the lockdown in the US, the company’s income was directly cut off and lost $600,000. The company then transformed into providing products to hospitals and testing sites, but the existing sales team had no resources for hospital customers and used ZoomInfo to mine new customers, increasing revenue by $200,000.
- 87% of revenue is from the US, and 13% is from international markets (mainly Canada and Western Europe). The penetration and international expansion of large customers has become the key to the company’s international strategy, and the company is currently working on a number of global projects.
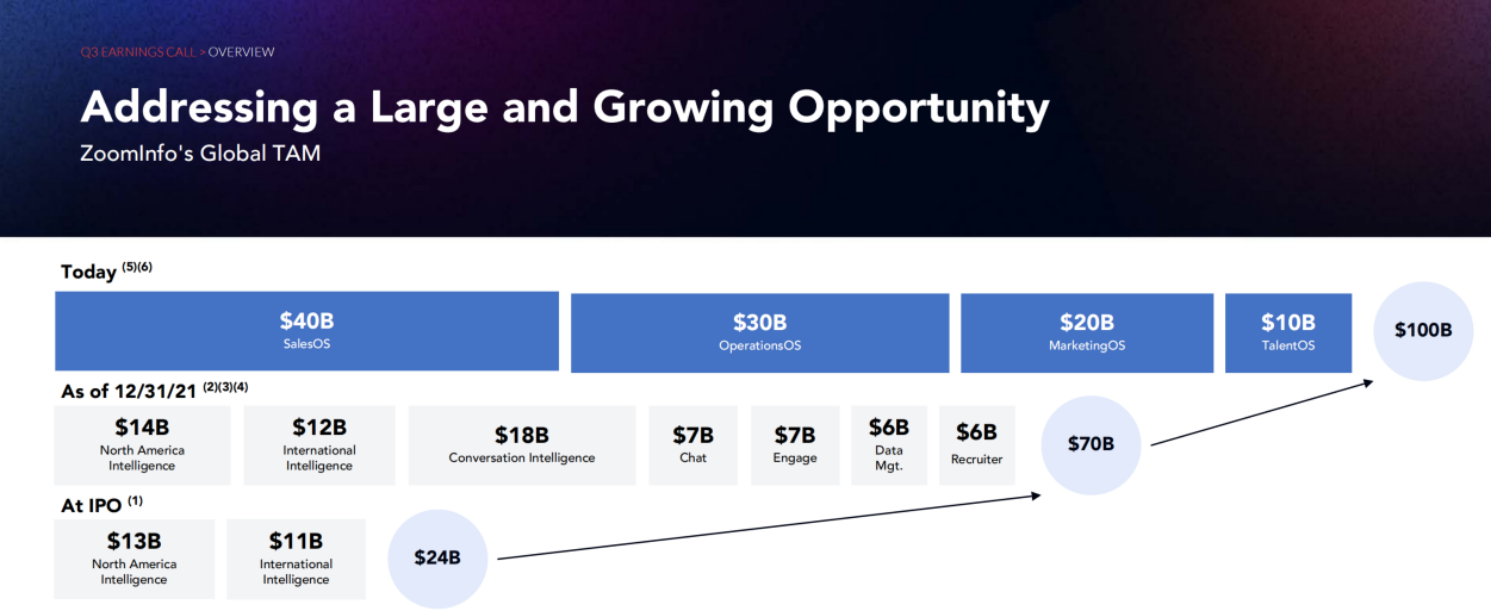
3.5 Market size TAM (Total Addressable Market): Based on its own database, ZI estimates that there are 70,000 B2B companies in the US. Currently, the company has more than 3,000 customers, with ample penetration and growth potential. From another perspective, there are 20,000 customers for CRM company Salesforce and marketing automation company Hubspot, both of which are strongly related to ZI and can be considered potential customers who have already adopted digital sales tools.
US market TAM – Using a conservative customer ACV of $2,000 (currently $3,800+), the static dollar-based market size in North America is $14 billion or more, and the digital sales market is still growing. Customers typically start with a data tool subscription, followed by a small-scale test of the return period, and then increase seat count and data package subscriptions based on the effectiveness of use and headcount. There are few cases where the entire team is covered directly, so there is still room for expansion of departmental and cross-departmental penetration among existing customers.
International market TAM – The international market, mainly in Canada and Western Europe, still has a large number of B2B companies, with both the supply and demand sides relatively dispersed. The TAM is estimated at $12 billion. ZI’s overseas expansion is still in its early stages. In January 2022, ZI expanded its London office and announced the appointment of Simon McDougall, the former Deputy Commissioner of the UK Information Commissioners Office, as the company’s first Chief Compliance Officer, in preparation for the expansion into the European market and compliance regulation.
Tool product TAM – The strategy for bundling and selling tool products is clear, and there is market demand, but there are many alternative products, such as chat, customer engagement, and recruiting, which have best-in-breed point solutions. The estimated TAM for the company is conservative and can be considered objectively and accurately. Assuming that the actual reachable market size is 1/3 to 1/2 of the company’s estimate, this TAM is $18-28 billion.
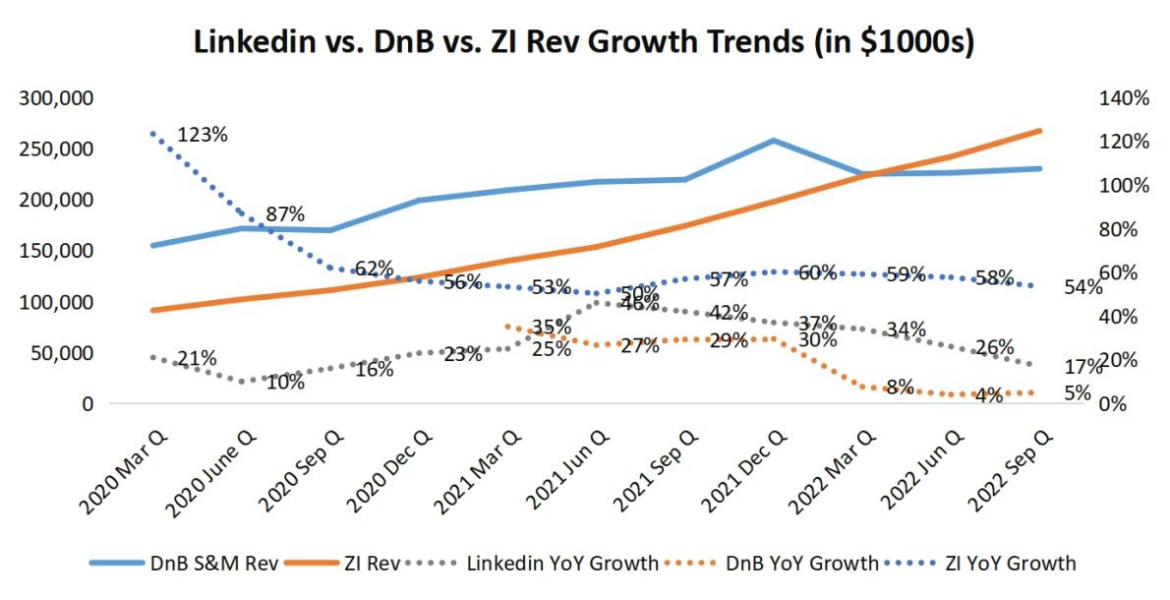
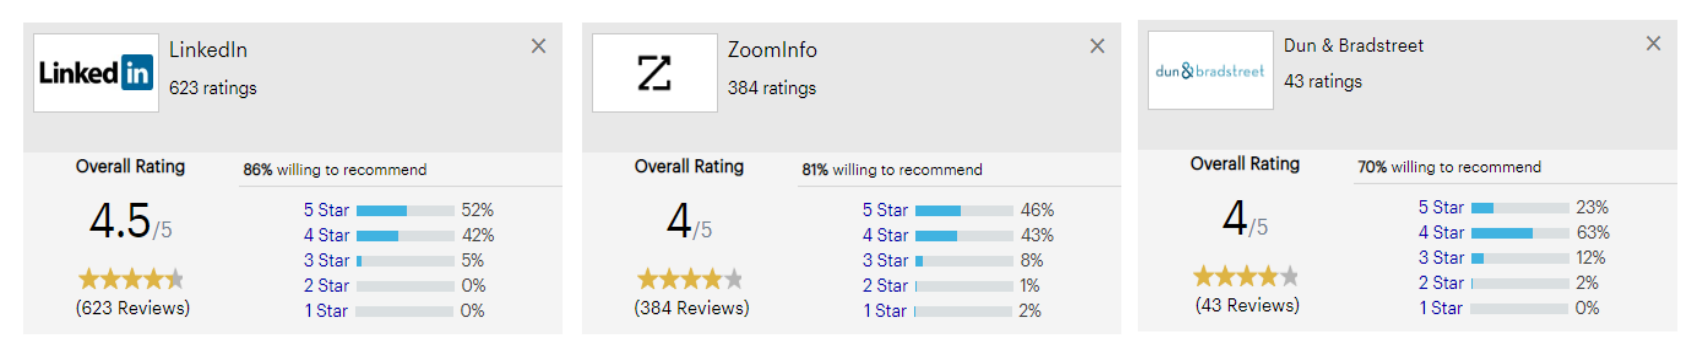
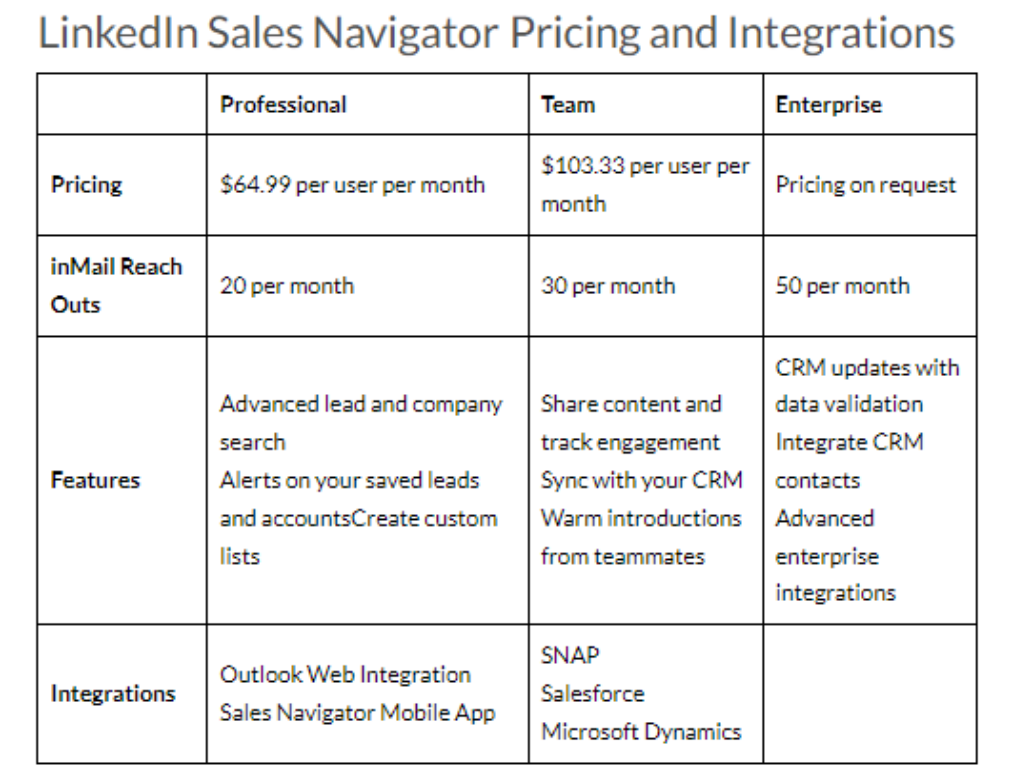
3.6 Competitive Landscape: The market consists of two strong players and one older player, along with numerous VC-funded start-ups. ZI’s main competitors are Microsoft’s LinkedIn Sales Navigation (LSN), the older data company Dun & Bradstreet (DnB), and other niche B2B data and tool companies that focus on sales, such as Gong, Salesloft, 6sense, Appolo.ai, Lead411, Data Axle, Clearbit, Demandbase, Salesgenie, and LeadGenius.
In Q4 2022 (July), Microsoft disclosed that LinkedIn has more than 850 million users worldwide, with Q4 total revenue growing 26% year-over-year and Talent Solutions revenue exceeding $6 billion and Marketing Solutions revenue exceeding $5 billion. Both Sales Navigation and ZI are important tools for front-end salespeople, and although they currently compete, they are not completely interchangeable. Many users use both, each having its own advantages and disadvantages in different use cases (see User Interview Recordings in Section 9). ZI’s most frequent use case is searching for the target company, key person, and contact information. LinkedIn has a unique advantage based on its social network when it comes to clearly identifying who to contact through InMail, but the InMail response rate cannot completely replace direct phone or email contact. Sales Navigator has not yet entered ZI’s core B2B data field, but Microsoft is a significant ecological partner and potential competitor.
As of Q3 2022, D&B’s Sales & Marketing Solutions TTM revenue was $9.4 billion, with Q3 revenue growing 5% year-over-year, with international revenue representing 22%. D&B is an older provider of corporate credit and data services, with data on 420 million businesses worldwide, with some first-mover advantage in overseas data, but it has largely been replaced by newer solutions such as ZI in the marketing space.
For detailed ZoomInfo competitive product features and pricing analysis, see the link below:
https://revpilots.com/2022/02/22/zoominfo-competitors/#ZoomInfo_Competitors_That_Are_Pricey
4.0 M&A History:
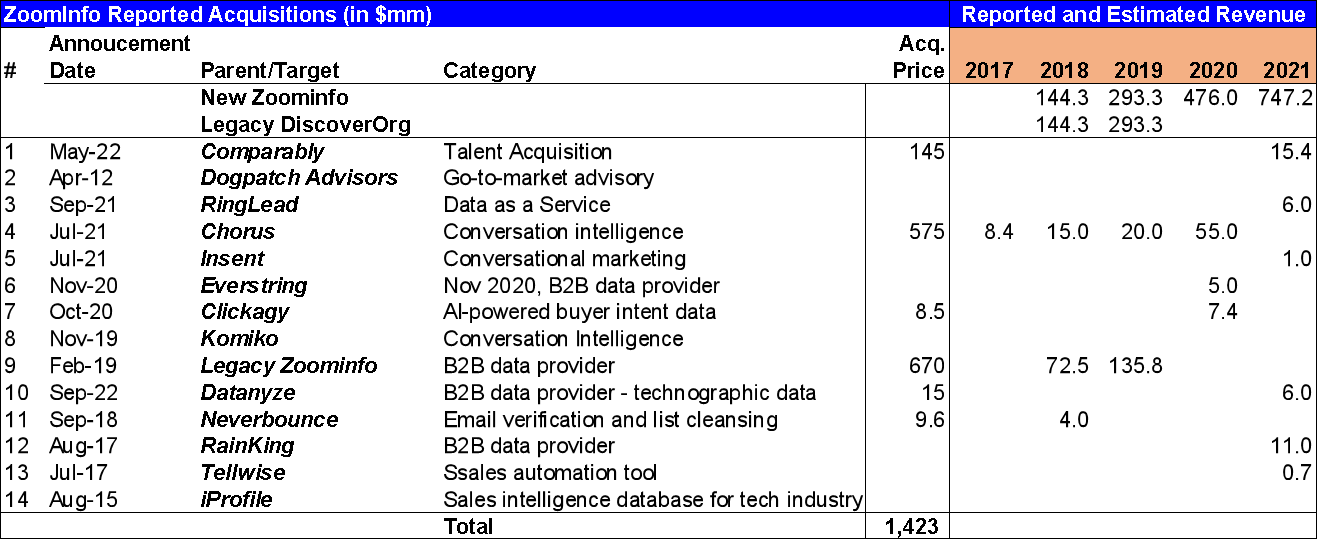
Since its founding in 2007, ZoomInfo has completed 14 public acquisitions. The three largest acquisitions were the acquisition of data company Legacy ZoomInfo for $670 million in April 2019, the acquisition of Conversation Intelligence company Chorus for $575 million in July 2021, and the acquisition of recruitment website Comparably for $145 million in May 2022, with purchase prices ranging from ~9-10 times PS.
ZoomInfo has issued debt multiple times for acquisitions, and currently has $1.25 billion in long-term debt on its books. Its TTM EBITDA is $210 million and it has $410 million in cash. It has ample capacity to repay debt and leverage further. Multiple acquisitions have accumulated $1.7 billion in goodwill, as well as $4 billion in Deferred Tax Assets and $3 billion in Tax Receivable Agreement Liability, which affects the calculation of equity and ROIC in the denominator. Therefore, the accounting ROIC appears low, but the actual ROIC is likely to be significantly higher than 10% (actual ROIC requires separate estimation).
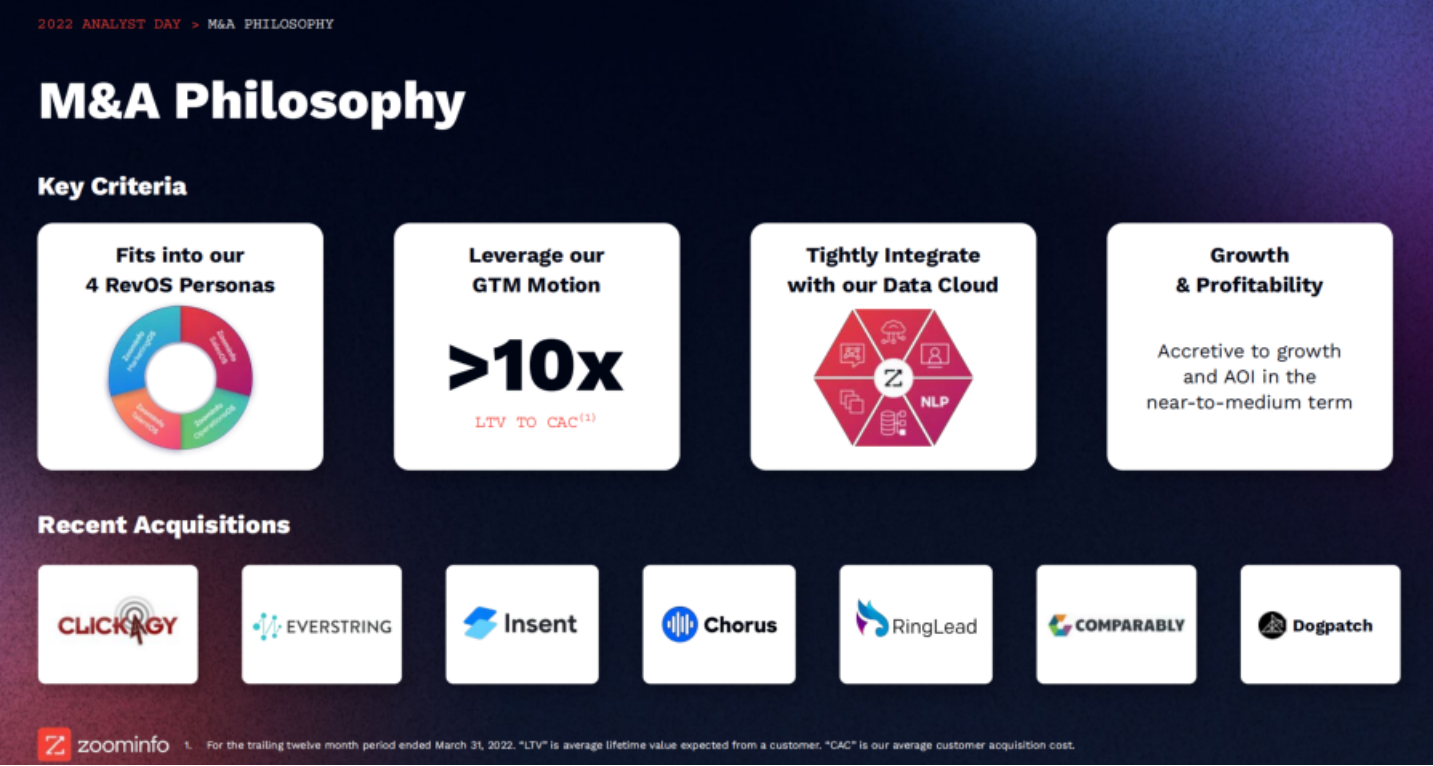
Based on past M&A cases and ZoomInfo’s M&A strategy announced at its 2022 Analyst Day, the logic for future acquisitions is 1) not to overpay, 2) to have synergistic effects with the existing product matrix, 3) to meet the conditions of fast customer acquisition cost recovery, 4) to integrate with existing data sets, and 5) to bring gains to growth and return on investment in the short to medium term.
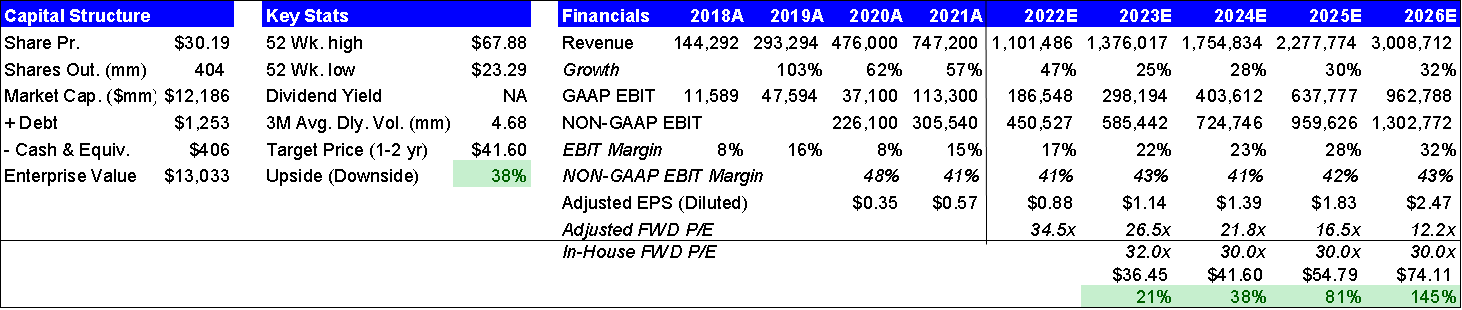
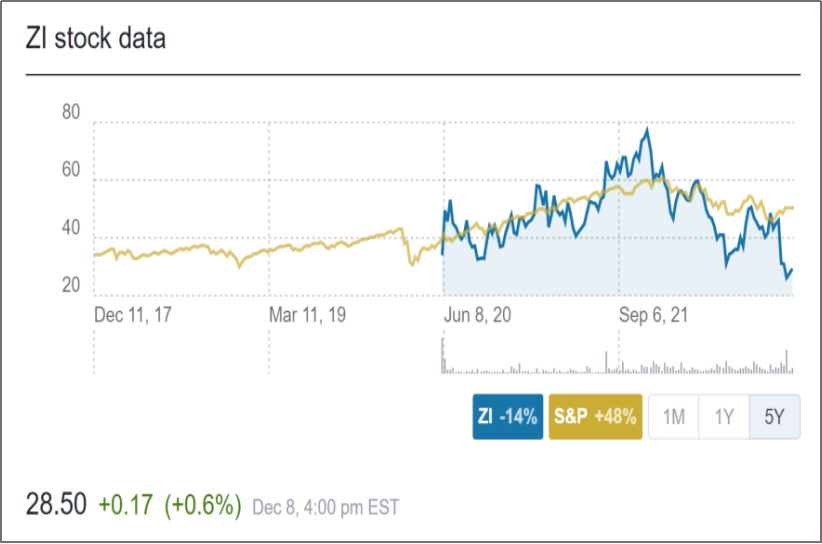
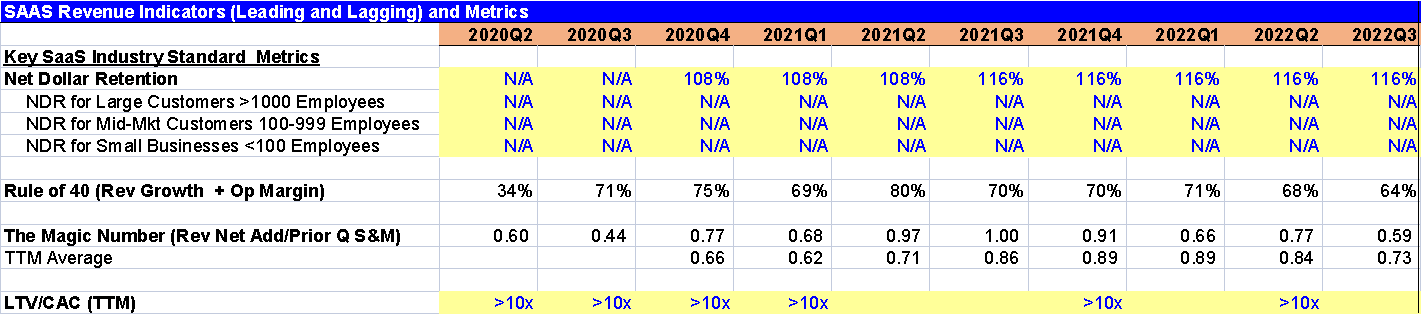
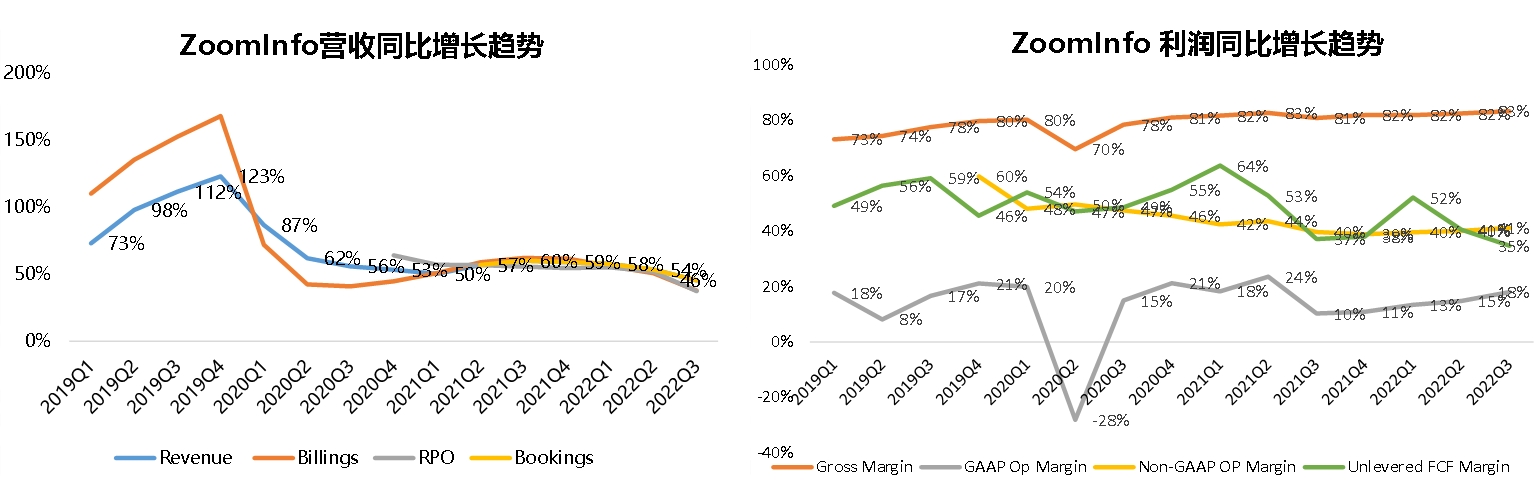
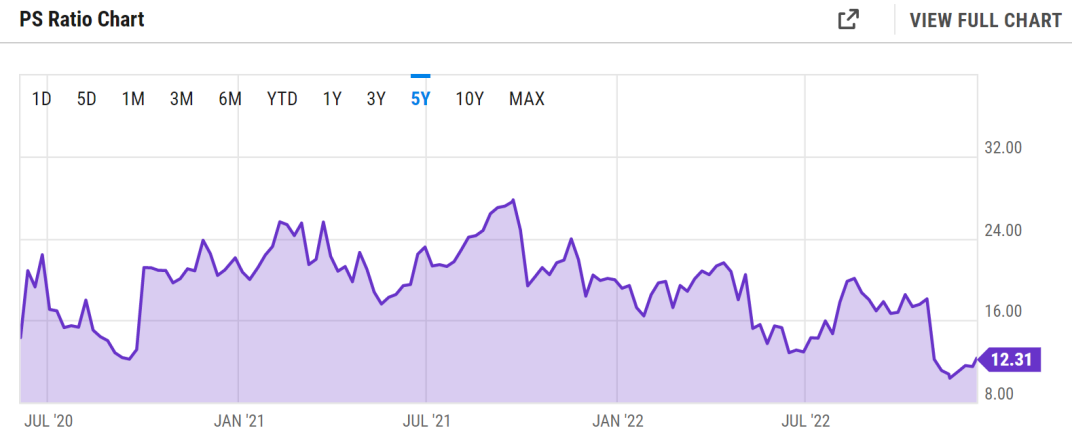
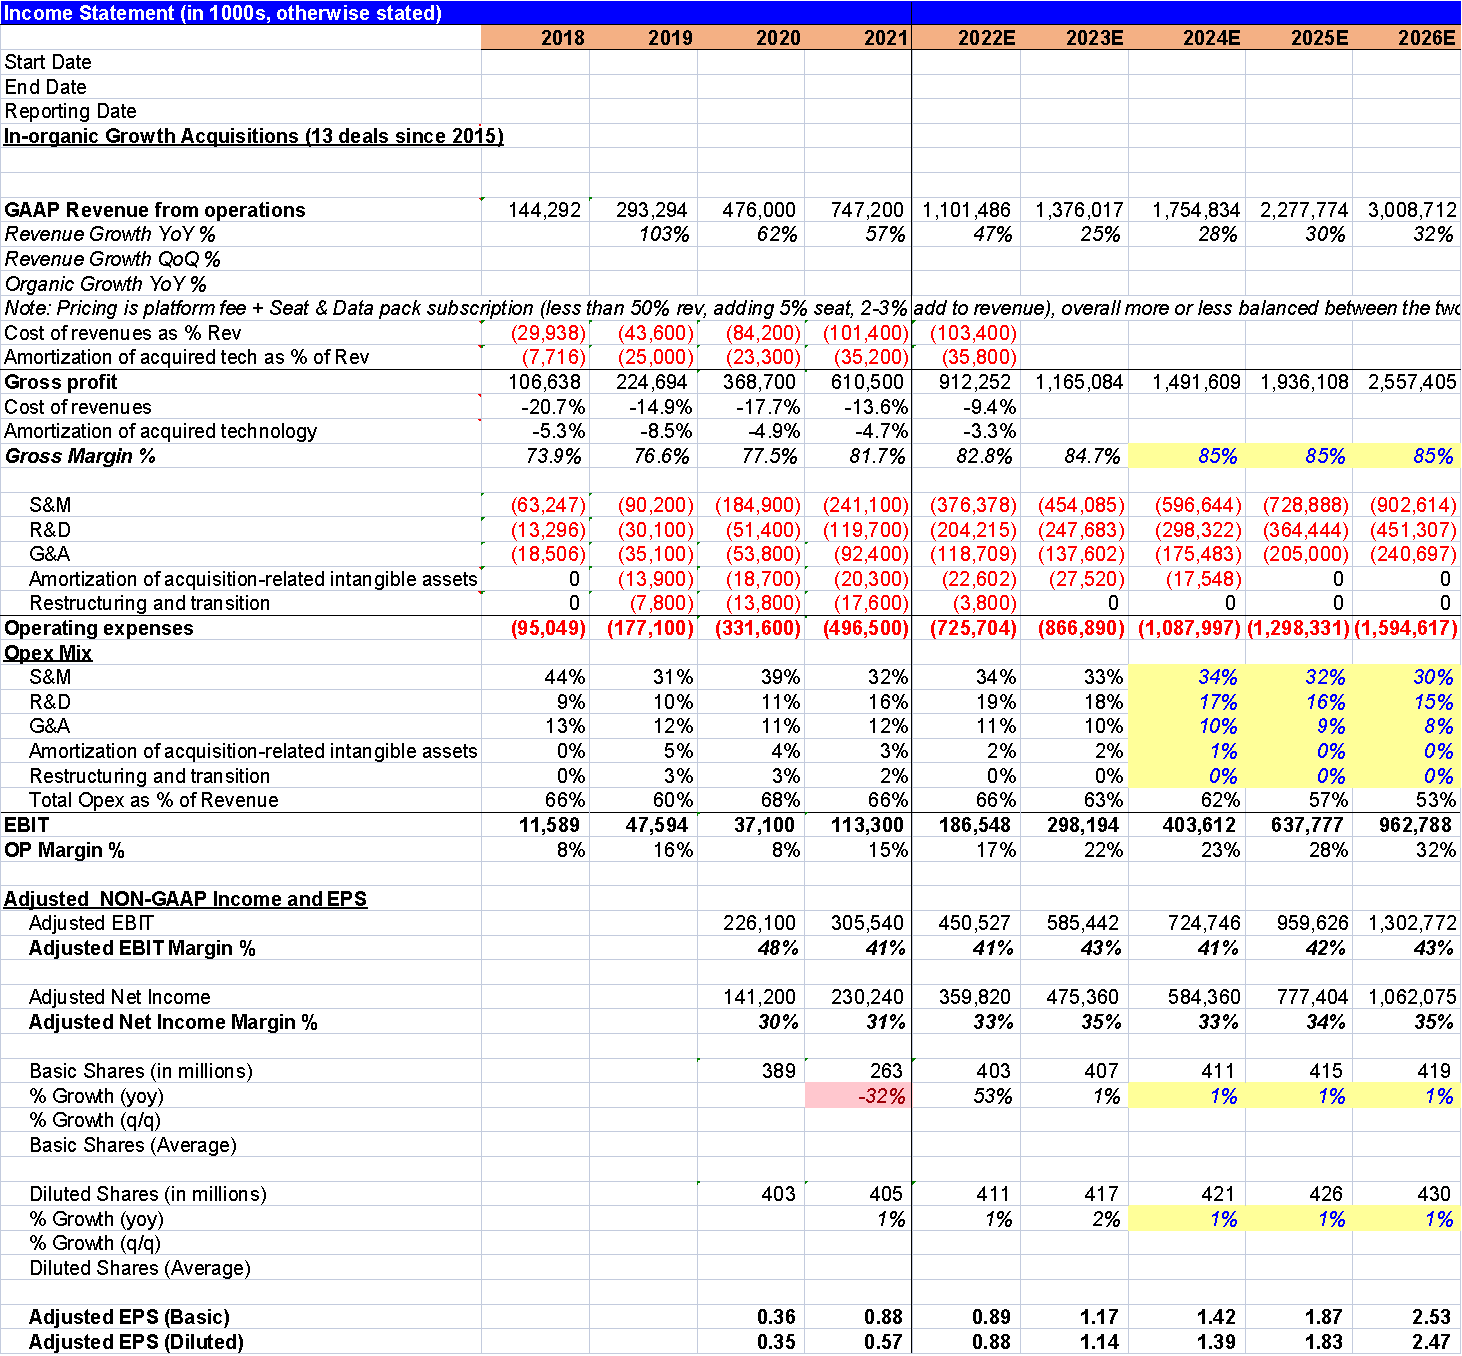
5.0 Historical Financials: Since the IPO in April 2019, the company has maintained a high growth rate in SaaS, with a three-year revenue CAGR of 54% (exceeding 75% of sample companies) and stable profitability and cash flow production capability compared to the vast majority of loss-to-growth SaaS companies. In the past two years, the average gross margin has been 82%+ and the GAAP EBIT Margin is approximately 16%, while the adjusted EBIT Margin is around 42% (excluding SBC and acquisition transaction fees, etc. non-cash/one-time expenses) and the Unlevered FCF Margin is approximately 47%. After the IPO, the company’s valuation also experienced inflation along with the SaaS sector, reaching a market value of $34.6B at one point, but as the SaaS sector as a whole has declined, the company’s market value has also fallen by about 64% from its high, with its valuation at a historical low since the IPO.
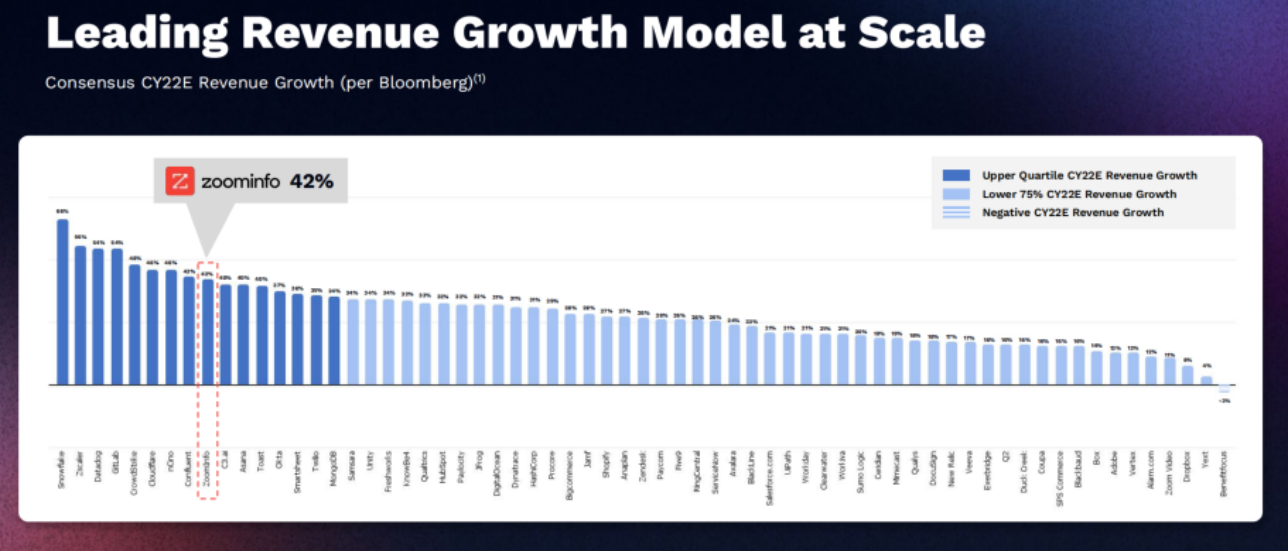
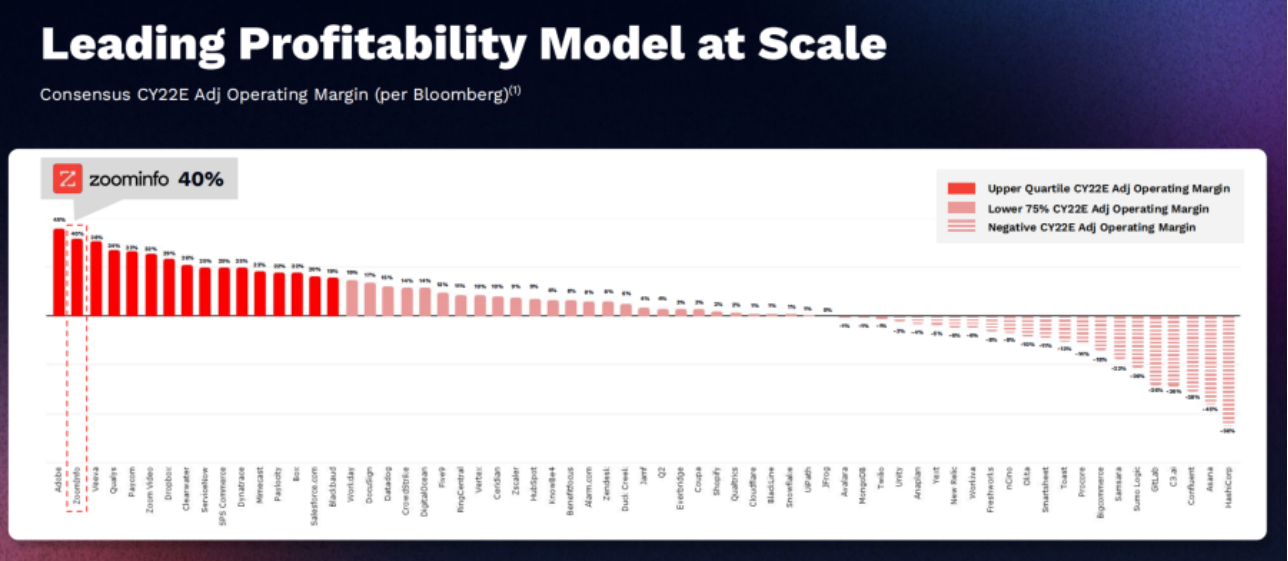
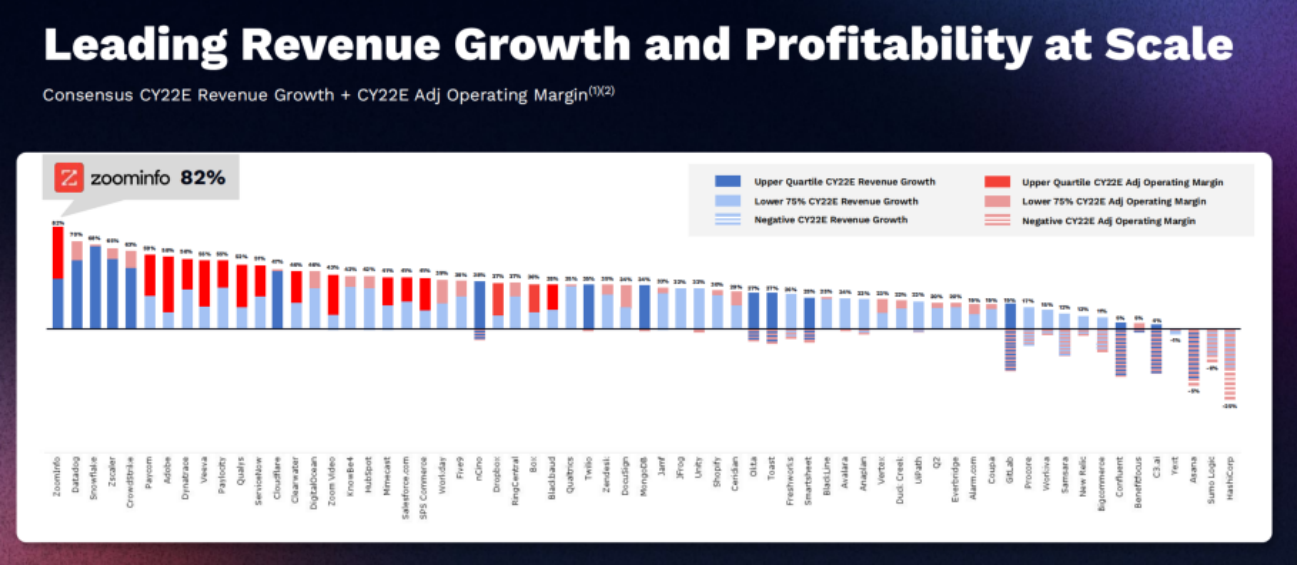
Based on the Bloomberg CY22 Consensus Estimate, ZoomInfo’s revenue growth and NON-GAAP Operating Margin both exceed those of 75% of SaaS companies, with the Op Margin second only to Adobe. Since going public, ZoomInfo has consistently exceeded market expectations and raised its full-year guidance each quarter, with average revenue exceeding expectations by 5% and EPS exceeding expectations by 24%. The reduction in FCF guidance for Q3 2022 is mainly due to the lengthening of the sales cycle due to the macro environment and some customers requesting more flexible payment cycles (currently mainly paid annually or quarterly in advance for subscription fees).

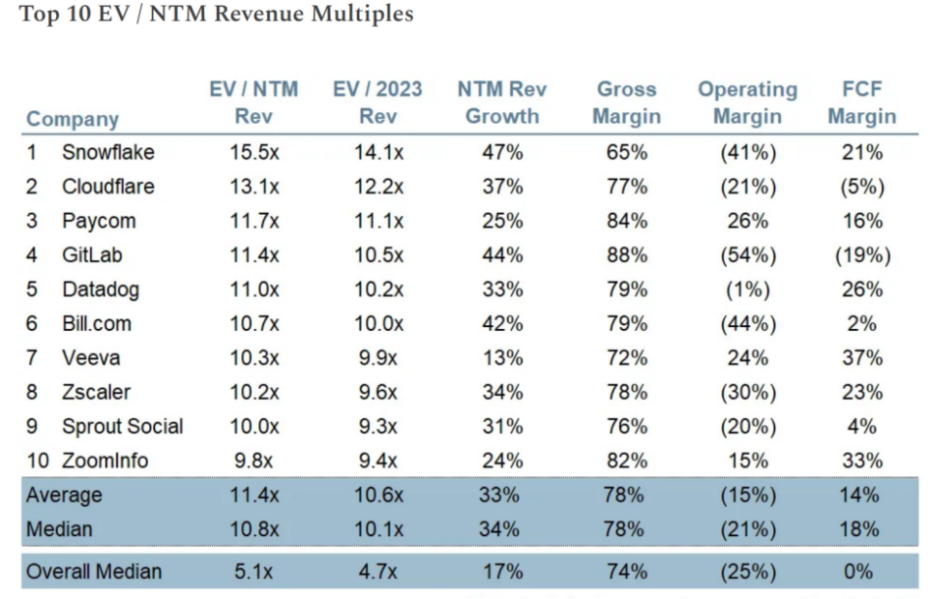
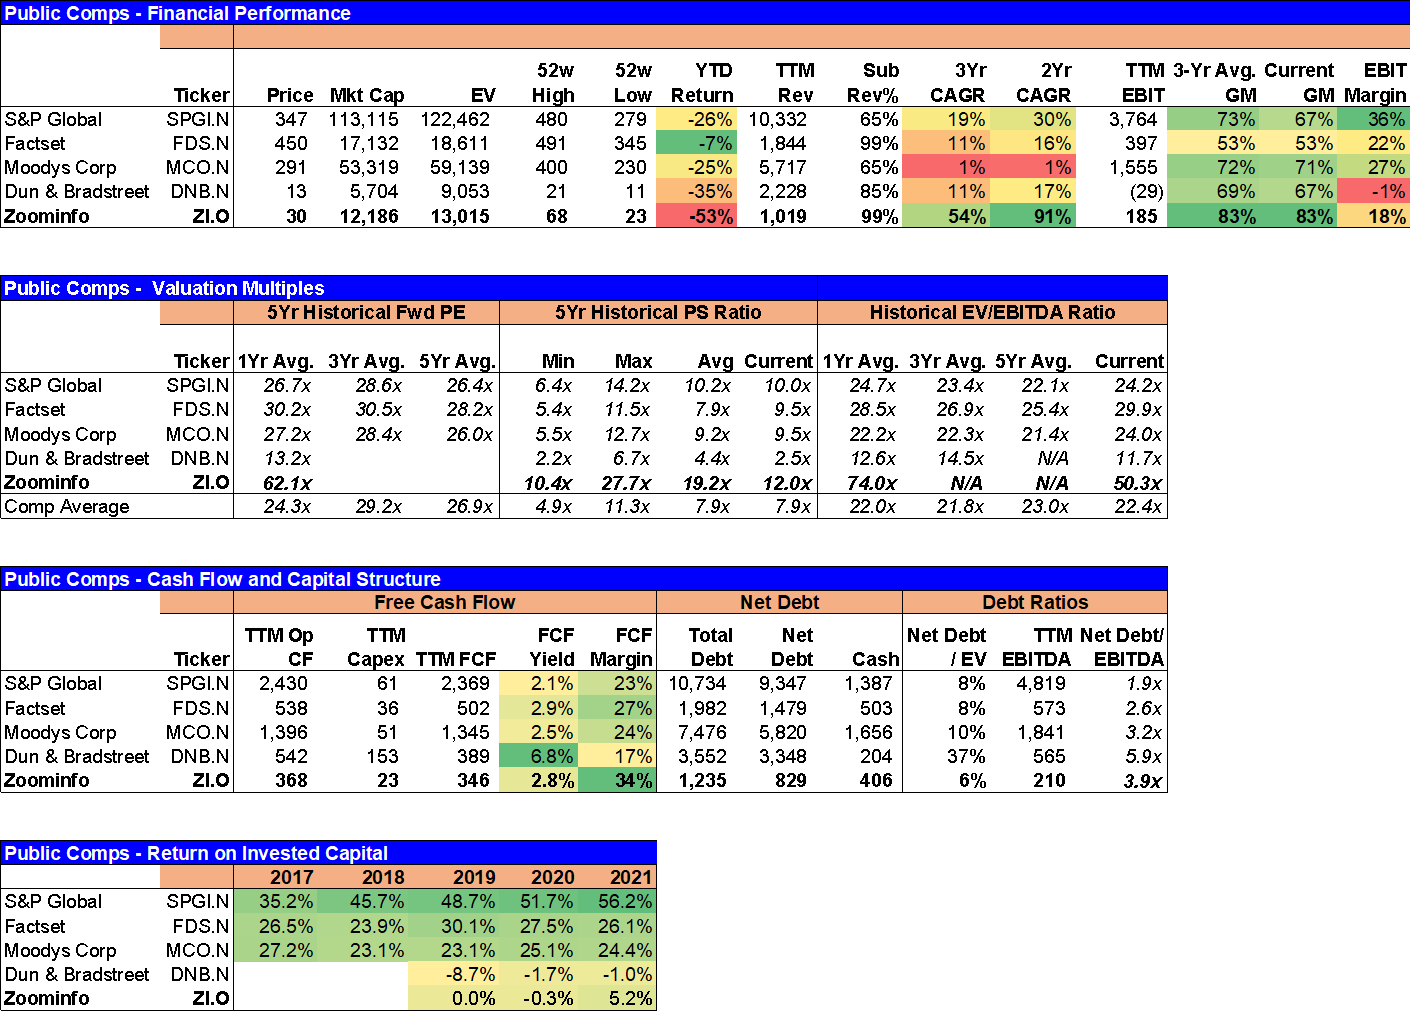
6.0 Publicly Traded Comps: ZoomInfo is often grouped with high-multiple SaaS companies like Snowflake and Cloudflare. Among the ten SaaS companies with the highest multiples, ZoomInfo’s valuation, margins, and FCF performance are all better than the average for SaaS peers. The ~15% share-based expense SBC is also lower than that of SaaS peers, and shareholder dilution is relatively low. In terms of the nature of its business model and products, ZoomInfo is more similar to financial/corporate data software companies like S&P Global, FactSet, Moodys, and Dun & Bradstreet. Excluding the slow-growing DnB, the comparable companies have maintained an average Forward PE of around 27-30X over the past 3-5 years. Based on ZoomInfo’s superior growth, high FCF margin, and improving EBIT Margin and ROIC, it is conservatively estimated that the Forward PE can be maintained at 30X+ for the next 1-2 years. Based on the in-house estimated Adjusted EPS of $1.39 for 2024E, the per-share valuation is $41.6, with a two-year holding return of ~40%.
7.0 Implied Total Return Framework: Another way to measure investment return is to skip traditional financial analysis such as DCF and decompose the expected total return into four parts based on the fundamentals of the business and competitive landscape.
Assuming that TTM Adjusted EBIT does not grow in the future, the earnings yield is 2.6% by dividing the current post-tax operating profit by the market value.
ZoomInfo does not pay dividends, so the dividend yield is 0%.
Since the dividend payout is 0%, 100% of operating profit is invested back into the company, resulting in positive reinvestment returns when ROIC is greater than the Cost of Capital. The difference between the two multiplied by the capital return rate (100%) is the 3.2% reinvestment return.
Assuming that the company’s steady-state organic growth is 15% (it has been over 50% for the past three years), the organic growth return is 15%.
The total expected return for a long-term hold is ~20%+. This estimate is based on ZoomInfo’s ability to maintain its current leading market position and profitability, its ability to continue to have a positive capital investment in its customer base, product offerings, and acquisition targets, and its ability to maintain 15% organic growth. From the perspective of industry competition, as a leading company, ZoomInfo has a strong advantage and financial resources to expand market share, with a medium to high moat

8.0 Future Growth Drivers and Catalysts:
Better-than-expected CPI data and a slowdown in the Federal Reserve’s rate hikes will benefit the SaaS sector, which is strongly correlated with the interest rate cycle. Better-than-expected inflation data will be a positive for the entire sector. EBIT Margin and ROIC will continue to improve. Data SaaS products have low marginal costs and leverage and have low capital expenditure (whether R&D expenditure needs to be capitalized needs further analysis). As revenue volume increases and growth stabilizes at 20%, there is still room for improvement in GAAP Margin and ROIC. The estimated steady-state GAAP EBIT Margin is expected to be as high as 20% or as low as 30%, and the GAAP EBIT Margin in Q3 2022 was 18%. ROIC will also improve as acquisitions-related debt decreases and goodwill returns to industry levels (see above for comps analysis).
Microsoft Linkedin is entering the enterprise database field. In theory, Microsoft can enter ZoomInfo’s core market based on its own Linkedin, Dynamics CRM, and cloud database products, but has not yet fully entered. Linkedin and Sales Navigator will continue to focus on career networking and B2B sales tools for the time being, but it is necessary to closely monitor Microsoft’s competitive risk in the long run.
Data privacy supervision. US regulatory agencies and the European GDPR both isolate enterprise data and business-related personnel data from personal privacy protection. ZoomInfo attaches importance to data privacy protection and compliance and has an early layout, actively notified Opt-out and Do Not Call program for collecting personal data. In Q4 2021, the company recruited its first Chief Compliance Officer, and the product backend can provide access to different regional sales teams for cross-state and cross-border enterprises based on different state and national legal requirements. Currently, the privacy risk of core data products is controllable. However, there has been user feedback that ZoomInfo’s conversation intelligence tool Chorus has concerns when recording customer conversations and screen recordings, although there is no regulatory risk at present, it may affect the adoption rate of customers who attach importance to privacy. Strong regulation may be disadvantageous to small and medium-sized B2B data enterprises.
The US economy enters a recession. In the second half of 2022, enterprise customers are expected to strengthen their expectations of economic recession, ZI observed that the sales cycle began to lengthen, and the sales department’s budget required more financial or CFO approval, coupled with an increase in renewal subscriptions as a percentage of sales workload, insufficient bandwidth for sales personnel, new logo new customer development work being squeezed, and expected revenue growth of about 20% in 2023. In the short term, economic recession periods can lead to budget delays, cuts, and more careful market investments, and may affect the adoption rate of data products.
8.0 Continued focus points for future quarterly reports:
Bookings and RPO growth rate
Dollar-based Net Retention Rate callback range
Large customer Net Add growth rate
NON-GAAP and GAAP EBIT Margin marginal improvement trend
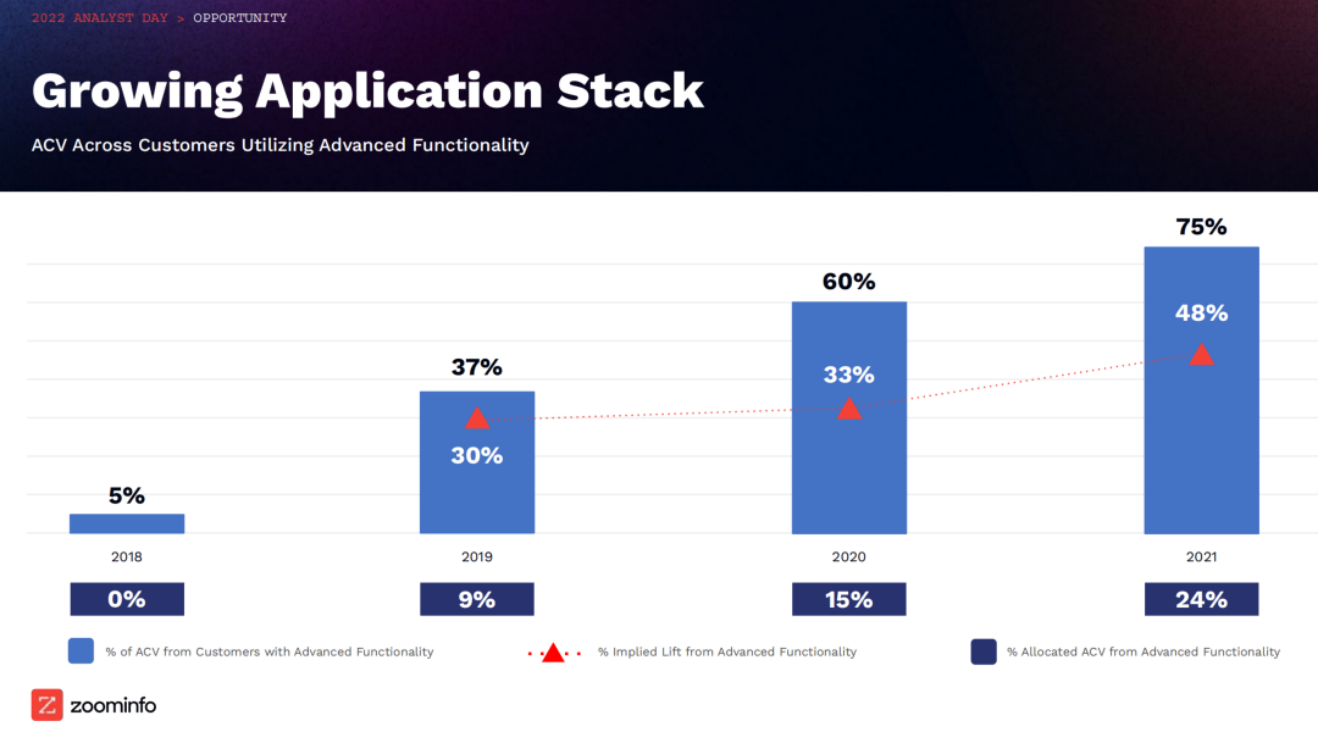
Percentage of ACV for advanced functionality modules (bundled sales ACV uplift)
Expansion and growth rate of international business
Competition with LinkedIn Sales Navigator
